
Blog 68
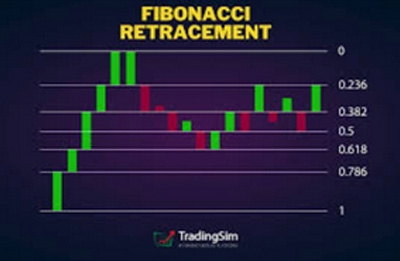
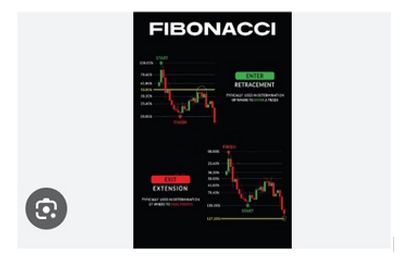
Fibonacci Retracement is a technical analysis tool used to identify potential support and resistance levels during a price retracement. It's based on the Fibonacci sequence, a mathematical sequence found in nature, and uses specific ratios (23.6%, 38.2%, 50%, 61.8%, and 78.6%) to predict price reversals.
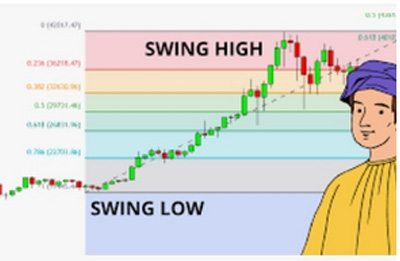
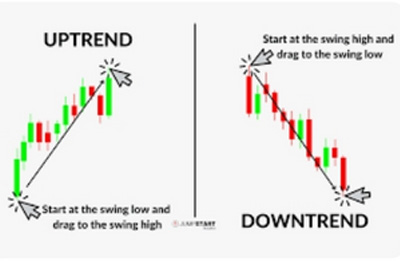
1. Identify a Trend: Determine whether the market is in an uptrend or downtrend.
2. Draw the Retracement Lines:
• Uptrend: Draw a line from the recent swing low to the recent swing high.
• Downtrend: Draw a line from the recent swing high to the recent swing low.
The Fibonacci retracement tool will automatically calculate and display the key Fibonacci levels on your chart.

• In an uptrend, buy when the price bounces off the 23.6%, 38.2%, or 61.8% level.
• In a downtrend, sell short when the price bounces off the 23.6%, 38.2%, or 61.8% level.

• Set your take-profit target at the next significant Fibonacci level.
• Use a stop-loss order to limit potential losses.
• Combine with Other Indicators:
Use Fibonacci retracement in conjunction with other technical indicators like RSI, MACD, or Bollinger Bands for more accurate signals.

• Consider the overall market sentiment and news events that may influence price movements.

• Always use stop-loss orders to protect your capital.

• Practice using Fibonacci retracement on historical charts to develop your skills. Remember, successful trading takes time and patience.
If a cryptocurrency has recently experienced a significant uptrend, a potential buying opportunity might arise when the price retraces to the 61.8% Fibonacci level. If the price bounces off this level, it could signal a potential reversal and a new uptrend.
Remember, Fibonacci retracement is a tool, not a crystal ball. It's important to use it in conjunction with other technical analysis tools and to consider the broader market context.
Would you like to delve deeper into a specific aspect of Fibonacci Retracement or discuss other technical analysis tools?
Let's delve deeper into Fibonacci Retracement and its applications:
The Fibonacci sequence is a series of numbers where each number is the sum of the two preceding ones: 0, 1, 1, 2, 3, 5, 8, 13, 21, 34, 55, 89, 144, and so on. When these numbers are divided by each other, they produce ratios that are often found in nature and financial markets. These ratios are used to identify potential support and resistance levels.
• 23.6%: A minor retracement level.
• 38.2%: A significant retracement level.
• 50%: A psychological level that often acts as support or resistance.
• 61.8%: A major retracement level.
• 78.6%: A very strong retracement level.
1. Identify a Trend: Determine whether the market is in an uptrend or downtrend.
2. Draw the Retracement Lines:
• Uptrend: Draw a line from the recent swing low to the recent swing high.
• Downtrend: Draw a line from the recent swing high to the recent swing low.
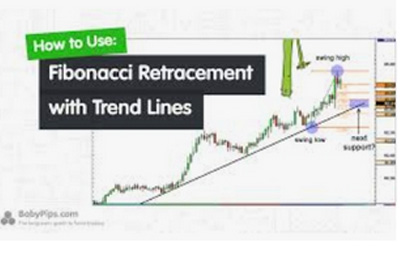
3. Identify Potential Support and Resistance Levels: The Fibonacci retracement tool will automatically calculate and display the key Fibonacci levels on your chart.

4. Trading Strategies:
Buy Low, Sell High:
• Uptrend: Buy near the 23.6% or 38.2% retracement level, expecting the price to bounce back to the previous high or even higher.
• Downtrend: Sell short near the 23.6% or 38.2% retracement level, expecting the price to continue its downward trend.
Take Profit and Stop-Loss:
• Set your take-profit target at the next significant Fibonacci level or a key resistance/support level.
• Place a stop-loss order below the recent swing low (for long positions) or above the recent swing high (for short positions).
• Combine with Other Indicators: Use Fibonacci retracement in conjunction with other technical indicators like RSI, MACD, or Bollinger Bands for more accurate signals.
• Market Context: Consider the broader market context, including economic news, geopolitical events, and overall market sentiment.
• Risk Management: Always use stop-loss orders to limit potential losses.
• Practice and Patience: Practice using Fibonacci retracement on historical charts to develop your skills. Remember, successful trading takes time and patience.
By mastering Fibonacci retracement and combining it with other technical analysis tools, you can improve your trading decisions and increase your chances of success.
Would you like to discuss other technical analysis tools or specific trading strategies?
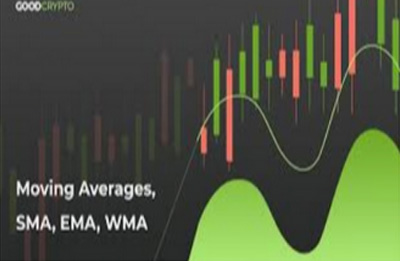
Moving Averages:
• Simple Moving Average (SMA): Calculates the average price of a security over a specific period.
• Exponential Moving Average (EMA): Gives more weight to recent prices, making it more responsive to price changes.
• Golden Cross: When the 50-day EMA crosses above the 200-day EMA, it's often seen as a bullish signal.
• Death Cross: When the 50-day EMA crosses below the 200-day EMA, it's often seen as a bearish signal.
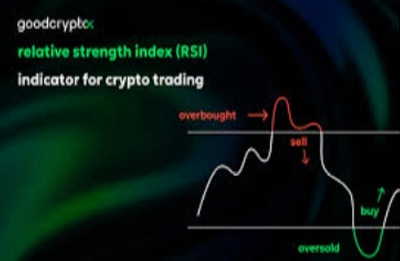
• Measures the speed and change of price movements.
• Overbought: RSI above 70 indicates the asset is overbought and may be due for a correction
• Oversold: RSI below 30 indicates the asset is oversold and may be due for a rebound.
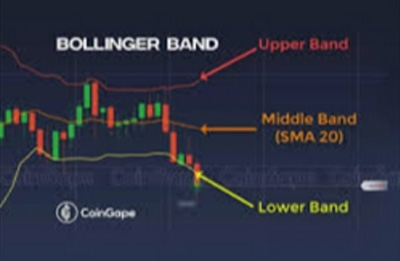
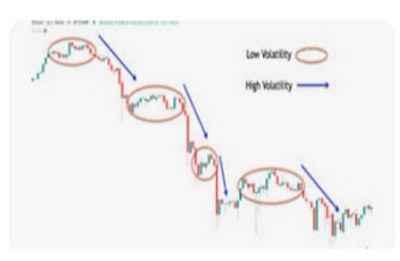
• Show volatility and potential price extremes.
• Narrow Bands: Indicate low volatility and potential breakout.
• Wide Bands: Indicate high volatility and potential price swings.
• Fibonacci Retracement and Moving Averages: Identify potential support and resistance levels and confirm trend direction.
• RSI and Bollinger Bands: Determine overbought/oversold conditions and potential price reversals.

• No Indicator is Perfect: Technical analysis is not foolproof.
• Risk Management: Always use stop-loss orders to limit potential losses.
• Practice and Patience: Practice using these tools on historical data to develop your skills.
Would you like to explore a specific trading strategy or discuss how to use these tools in conjunction with fundamental analysis?
While technical analysis provides valuable insights into price trends and patterns, it's crucial to complement it with fundamental analysis for a more holistic approach to trading.
Fundamental Analysis involves assessing the intrinsic value of an asset by considering factors such as:
• Economic Indicators: GDP growth, inflation rates, interest rates, etc.
• Industry Trends: Technological advancements, regulatory changes, and competitive landscape.
• Company Financials: Revenue, earnings, debt, and cash flow.
• Market Sentiment: Investor sentiment, media coverage, and social media trends.
• Identify Potential Investments: Use fundamental analysis to identify promising cryptocurrencies or projects with strong fundamentals.
• Timing Your Entry: Employ technical analysis to determine optimal entry and exit points. For instance, you might use Fibonacci retracement to identify potential support and resistance levels.
• Risk Management: Utilize both technical and fundamental analysis to set appropriate stop-loss and take-profit orders.
• Adaptability: Be prepared to adjust your strategy as market conditions change.
Let's say you've identified a promising cryptocurrency project through fundamental analysis. You can use technical analysis to:
• Time Your Entry: Wait for a bullish signal, such as a Golden Cross or a breakout from a consolidation pattern.
• Set Stop-Loss and Take-Profit: Use Fibonacci retracement to identify potential support and resistance levels.
• Monitor Market Sentiment: Use sentiment analysis tools to gauge market sentiment and adjust your strategy accordingly.
• Diversification: Spread your investments across various cryptocurrencies to reduce risk.
• Continuous Learning: Stay updated on the latest trends and developments in the crypto market.
• Emotional Control: Avoid making impulsive decisions based on fear or greed.
By combining technical and fundamental analysis, you can make more informed trading decisions and increase your chances of 1 long-term success.
A Bollinger Band Squeeze is a technical analysis pattern that occurs when the Bollinger Bands narrow, indicating low volatility. This can signal a potential breakout in either direction.
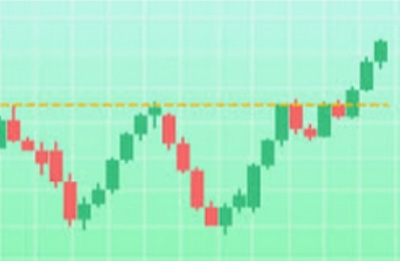
• Narrowing Bands: The upper and lower bands converge, indicating low volatility.
• Price Consolidation: The price action is confined within the narrow bands.
1. Breakout Strategy:
• Bullish Breakout: When the price breaks above the upper band, it's a bullish signal.
• Bearish Breakout: When the price breaks below the lower band, it's a bearish signal.
2. Mean Reversion Strategy:
• When the price touches one of the bands, it may revert back to the mean (the middle band).
• False Signals: It's important to use additional indicators to confirm the signal.
• Risk Management: Always use stop-loss orders to limit potential losses.
• Market Conditions: The effectiveness of this strategy can vary depending on market conditions.
• Momentum Trading: Identifying trends and riding them.
• Swing Trading: Holding positions for a few days or weeks.
• Day Trading: Buying and selling assets within a single trading day.
• Continuous Learning: Stay updated on the latest trends and developments in the crypto market.
• Risk Management: Prioritize risk management over potential rewards.
• Emotional Control: Avoid making impulsive decisions based on fear or greed.
By combining these strategies with a solid understanding of fundamental analysis, you can develop a comprehensive trading approach that maximizes your potential returns while minimizing risk.