
Blog 82
Entering the world of crypto spot trading can be both exciting and overwhelming. For beginners, one key to success is understanding bullish patterns-chart patterns that indicate a potential upward movement in price. Recognizing these patterns can help you determine when to enter a trade and exit for small profits. Let's dive into the most common bullish patterns and how to use them effectively in crypto spot trading.
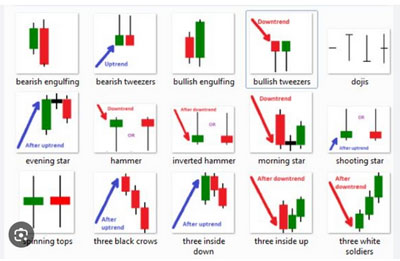
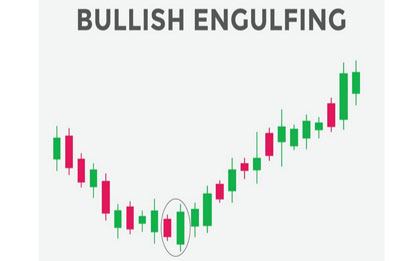
Bullish patterns are formations on price charts that signal a possible upward trend. They represent market sentiment turning optimistic, usually due to increased buying pressure. Spotting these patterns early can help traders capitalize on upward price movements.
• DeFi applications are expected to grow significantly, offering investors opportunities in staking, lending, and yield farming.
• Trend: More traditional financial institutions are integrating DeFi technologies.
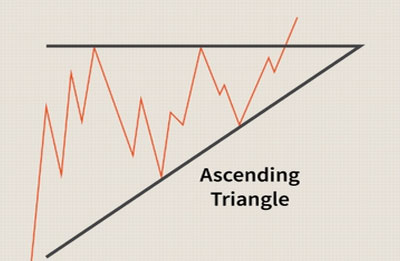
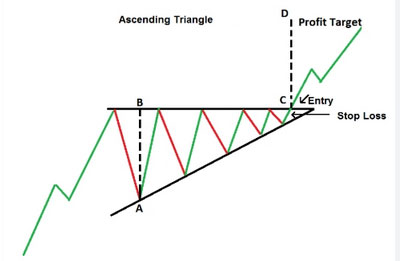
• How to Identify
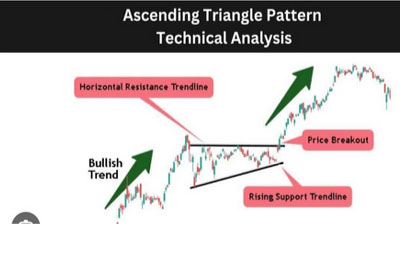
Look for a series of higher lows (an upward-sloping trendline) and a flat top at resistance.
• Entry Point
• When the price breaks above the resistance line with strong volume.
• Exit Point
• Target the distance between the widest part of the triangle added to the breakout point.

The bullish flag forms after a strong upward price movement (flagpole) and is followed by a small consolidation phase (flag). It suggests that the price may continue upward.
• How to Identify
Look for a steep rise (flagpole), followed by a rectangular consolidation that slopes slightly downward.
• Entry Point
• Enter when the price breaks out of the flag pattern in the direction of the initial trend.
• Exit Point
Set a profit target by measuring the flagpole's height and projecting it upward from the breakout point.

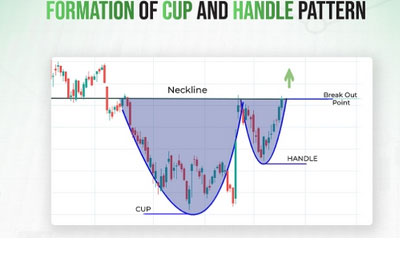
The cup and handle pattern is a bullish continuation pattern resembling a teacup. The "cup" has a rounded bottom, and the "handle" is a smaller consolidation
• How to Identify
Look for a rounded "U" shape followed by a small downward consolidation or sideways movement.
• Entry Point
When the price breaks above the handle's resistance line.
• Exit Point
Estimate your target by measuring the depth of the cup and adding it to the breakout point.

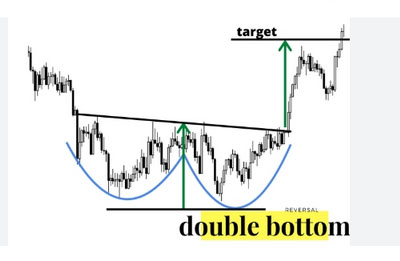
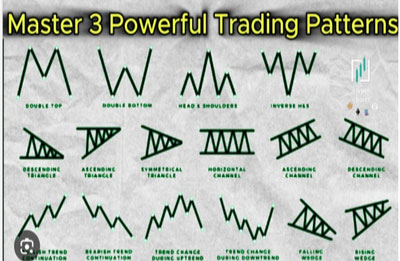
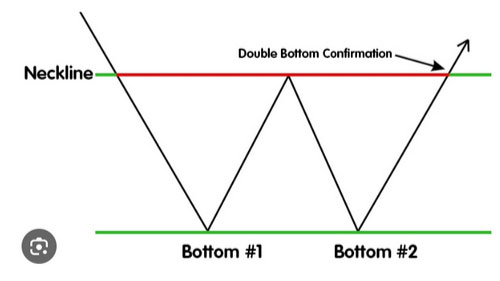
A double bottom occurs when the price forms two distinct lows at roughly the same level, creating a "W" shape. This pattern signals a potential reversal from a downtrend to an uptrend.
• How to Identify
Look for two equal lows separated by a moderate peak in between.
• Entry Point
Enter when the price breaks above the resistance formed by the peak between the two lows.
• Exit Point
The profit target can be the distance between the lowest low and the resistance, added to the breakout point.

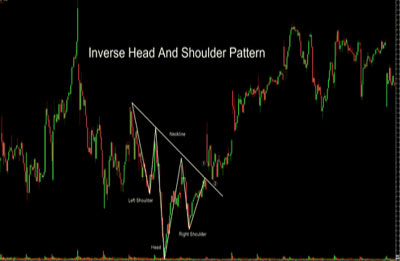
The inverse head and shoulders pattern signals a reversal from a downtrend to an uptrend. It consists of three troughs: the middle one (head) being the lowest and two smaller troughs on either side (shoulders).
• How to Identify
Look for three troughs, with the middle one deeper than the other two, and a neckline connecting the peaks of the shoulders.
• Entry Point
Enter when the price breaks above the neckline with strong volume.
• Exit Point
The target is calculated by measuring the distance between the head and the neckline and projecting it upward from the breakout point.


• Entry
Always wait for confirmation of a breakout. A strong candle closing above the resistance level or neckline, coupled with high trading volume, indicates a valid breakout. Enter the trade at this point.
• Exit
Exit the trade once your profit target is reached, as calculated using the pattern's characteristics. Consider setting a stop-loss slightly below the breakout point to manage risk in case the breakout fails.
High volume during a breakout indicates strong buying interest, which validates the pattern.
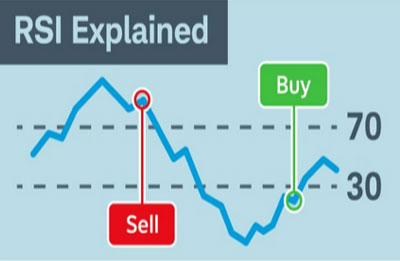
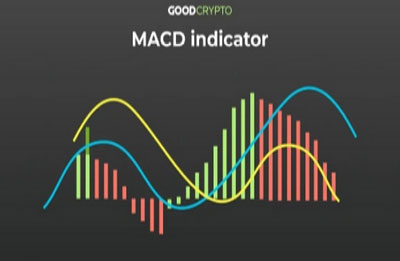
Use RSI, MACD, or moving averages to confirm bullish signals before entering a trade.
As a beginner, focus on smaller trades and avoid risking a significant portion of your capital.
Always set a stop-loss to limit potential losses and protect your investment.
Learning bullish patterns is an essential skill for crypto traders. By identifying these patterns and understanding their implications, beginners can make informed decisions about when to enter and exit trades. Remember, trading is not about predicting the market but reacting to patterns with discipline and a solid strategy.
With consistent practice and learning, you�ll soon develop the confidence to navigate the crypto market effectively. Start small, stay patient, and let the charts guide your journey.
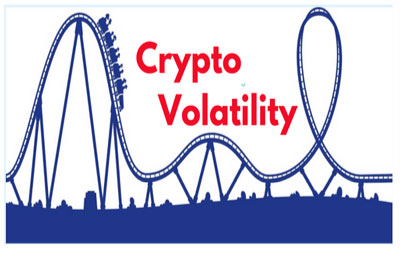
Bullish patterns have long been a cornerstone of trading, evolving from traditional financial markets to becoming a critical tool in crypto spot trading. Their origin, development, and rising significance in the cryptocurrency world highlight their importance as a reliable guide for traders looking to navigate volatile markets.
The concept of bullish patterns can be traced back to the early 20th century, closely tied to the development of technical analysis. Two key figures stand out in this history:
Known as the "father of technical analysis," Charles Dow laid the foundation for analyzing market trends. His work, known as the Dow Theory, introduced the idea of patterns as reflections of market psychology, categorizing them into uptrends, downtrends, and sideways trends.
In the 1930s, Schabacker further refined the study of chart patterns in his book Technical Analysis and Stock Market Profits. He identified many patterns that traders still use today, including bullish patterns like the Double Bottom and Head and ShoulShoulderations.

Over the decades, bullish patterns transitioned from theoretical concepts to practical tools used by traders across financial markets. Key milestones include:
• The Mid-20th Century
Technical analysts like W.D. Gann and Edwards & Magee popularized chart patterns, adding credibility and accessibility to the study of bullish formations.
• The 1990s
The advent of computers and digital charting tools made identifying and analyzing patterns faster and more accurate, paving the way for broader adoption.
• The 2010s
• With the rise of cryptocurrencies, traders began applying traditional technical analysis to these new assets. Bullish patterns quickly became a reliable method to navigate the highly volatile crypto market.
In the fast-paced and unpredictable world of cryptocurrency trading, bullish patterns have proven to be an invaluable resource. Here's why:


Bullish patterns rely on market psychology, making them universally applicable to all traded assets, including cryptocurrencies. Patterns like the Bullish Flag, Ascending Triangle, and Cup and Handle are frequently observed in crypto charts.
The crypto market is notorious for its rapid price movements. Bullish patterns help traders identify potential price reversals or continuations, giving them an edge in volatile conditions.
Unlike futures or leverage traders, spot traders rely heavily on entry and exit points for small but consistent profits. Bullish patterns provide clear signals for entering trades during uptrends and exiting before momentum wanes.

For beginners, navigating the crypto market can feel daunting. Bullish patterns act as a roadmap, simplifying complex price movements into recognizable formations.
Patterns often come with built-in stop-loss and profit-taking strategies, enabling traders to minimize risks while maximizing potential gains.
While no strategy is foolproof, bullish patterns have stood the test of time. Their frequent appearance in crypto charts gives traders confidence in using them as part of their decision-making process.

While bullish patterns offer valuable insights, it�s important to approach them with realistic expectations:
A pattern's reliability increases significantly when confirmed by other technical indicators like volume, RSI, or moving averages.
No pattern is 100% accurate. Factors like market sentiment, external news, and whale activity (large trades by influential holders) can override technical signals.
Experienced traders combine bullish patterns with other tools, such as fundamental analysis, to build a comprehensive trading strategy.
As the cryptocurrency market continues to grow and evolve, bullish patterns will likely remain a vital tool for traders. Their ability to reflect market psychology, adapt to price movements, and guide entry/exit decisions ensures their enduring relevance.
However, traders must remember that technical analysis is only one part of a successful strategy. A disciplined approach, continuous learning, and an understanding of market fundamentals are equally crucial for long-term success in crypto spot trading.
The history of bullish patterns is deeply rooted in the evolution of technical analysis, dating back to the early 20th century. From their origins in traditional financial markets to their widespread use in crypto spot trading, these patterns have proven to be a reliable guide for traders navigating price movements.
Learning and applying bullish patterns can be a game-changer for beginners entering the crypto space. With patience, practice, and proper risk management, traders can use these patterns to achieve consistent profits in the dynamic world of crypto trading.